产品描述:
Key Performance Specifications
DDR4-3200
DDR3-3200
Interposers to connect to any DDR4 target
Load-Reduced DIMM support (LRDIMM) enables up to 16 ranks per DIMM
Second slot support enables monitoring of a dul channel with one instrument – simultaneously
Interposers to connect to any DDR3 target
1G-sample acquisition depth
Thousands of real-time memory performance metrics
Real-time memory compliance margins and validation
All systems run concurrently (acquisition, performance, and compliance)
Continuous monitoring for up to 3.25 days
Programmable probe termination
11ps x 10mV x 40-channel analog characterization (iCiS™)
Continuous acquisition across clock stops and clock frequency changes
Trigger in and trigger out
Key Features
Integrated Windows 10 Controller
Application software ready for bench, remote-to-lab or offline operation
Application includes advanced listing, waveform, tables and charting
Turnkey setup, including automated MRW capture and analysis
Analyze thousands of real-time memory parameters
Full featured, industry standard trigger system
Automated analysis runs for everything from detailed setup information, to quick summary runs, to in-depth extended data logging or margin testing runs
Analog eye characterization on 20-channels simultaneously at 11ps x 10mV
Correlate with an oscilloscope for memory DQ data capture
Patented interposer/probe designs
Support for DIMM, SODIMM, miniDIMM, and/or x4/x8/x16 component interposers
Supports JEDEC Engineering Procedures JEP175 DDR4 Protocol Checks
Applications
DDR4 and/or DDR3
U-DIMM, R-DIMM, LRDIMM or component (x4/x8/x16/x32)
SODIMM or miniDIMM
Memory validation and debug
Monitoring bus traffic
Bus traffic measurement
Optimization of memory performance
Analog insight
DDR4 rates to DDR4-3200
DDR3 rates to DDR3-2667 (1.6GHz state clock capable)
Results Overview
Real-time Continuous Analysis
Real-time analysis provides data results during and after analysis runs which may be extremely long (days) or very short (nanoseconds). During the run, analysis is continuous and in real-time. Any event that occurs during the run is captured and analyzed.
Performance
Memory performance metrics include realtime margin metrics and margin violations. For each margin test, results indicate test coverage, observed margin values, as well as flags indicating margin violations. All data is continuously acquired in real-time with results updates continuously while the analyzer is still running.
Simultaneous State Capture
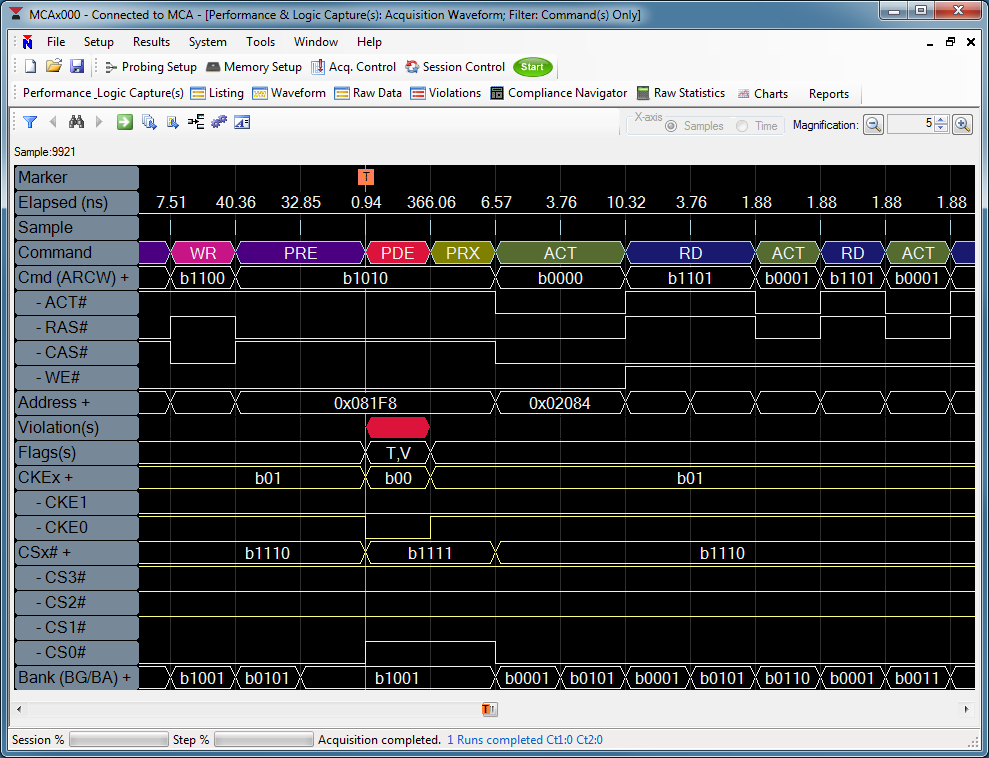
State capture results include continuous traffic around one or more events of interest. The traffic – consisting of time, bus commands, bus addressing, margin violations, and trigger events – is presented in listing or waveform displays. State capture depths from one hundred samples to one billion samples is available. Advanced acquisition controls monitor and respond to the continuous traffic in real-time to best utilize the state capture memory. Advanced post-capture search and filter can quickly parse the acquisition store.

Automated Analysis
Analysis is automated and continuous from the time the user clicks the Start button until the analysis session completes. While running, the session updates the application with real-time results. In the following image you can see real-time margins for all compliance parameters as well as a chart of read/write bus throughput. In this example, the analyzer is configured to continuously monitor acquire data until the first occurrence of a compliance violation occurs. That’s three simultaneous measurements, each collecting/monitoring real-time data!